Welcome to MRSDS!
The
Methane Research Science Data System (MRSDS) organization
hosts repositories related to data processing, analysis, and
visualization of atmospheric methane information at the full range
of spatial scales including local, regional and global. The collection
of software associated with this functionality is referred to as the
Multi-Scale Methane Analytic Framework (M2AF). Please
refer to
Jacob, et al. 2021 for additional background information about
M2AF software deployed across high performance computing and cloud
computing platforms. The primary visualization component for this work
is the Methane Source Finder (MSF) portal, and several of the code
repositories relate to the MSF front-end, back-end, and data ingestion
components.
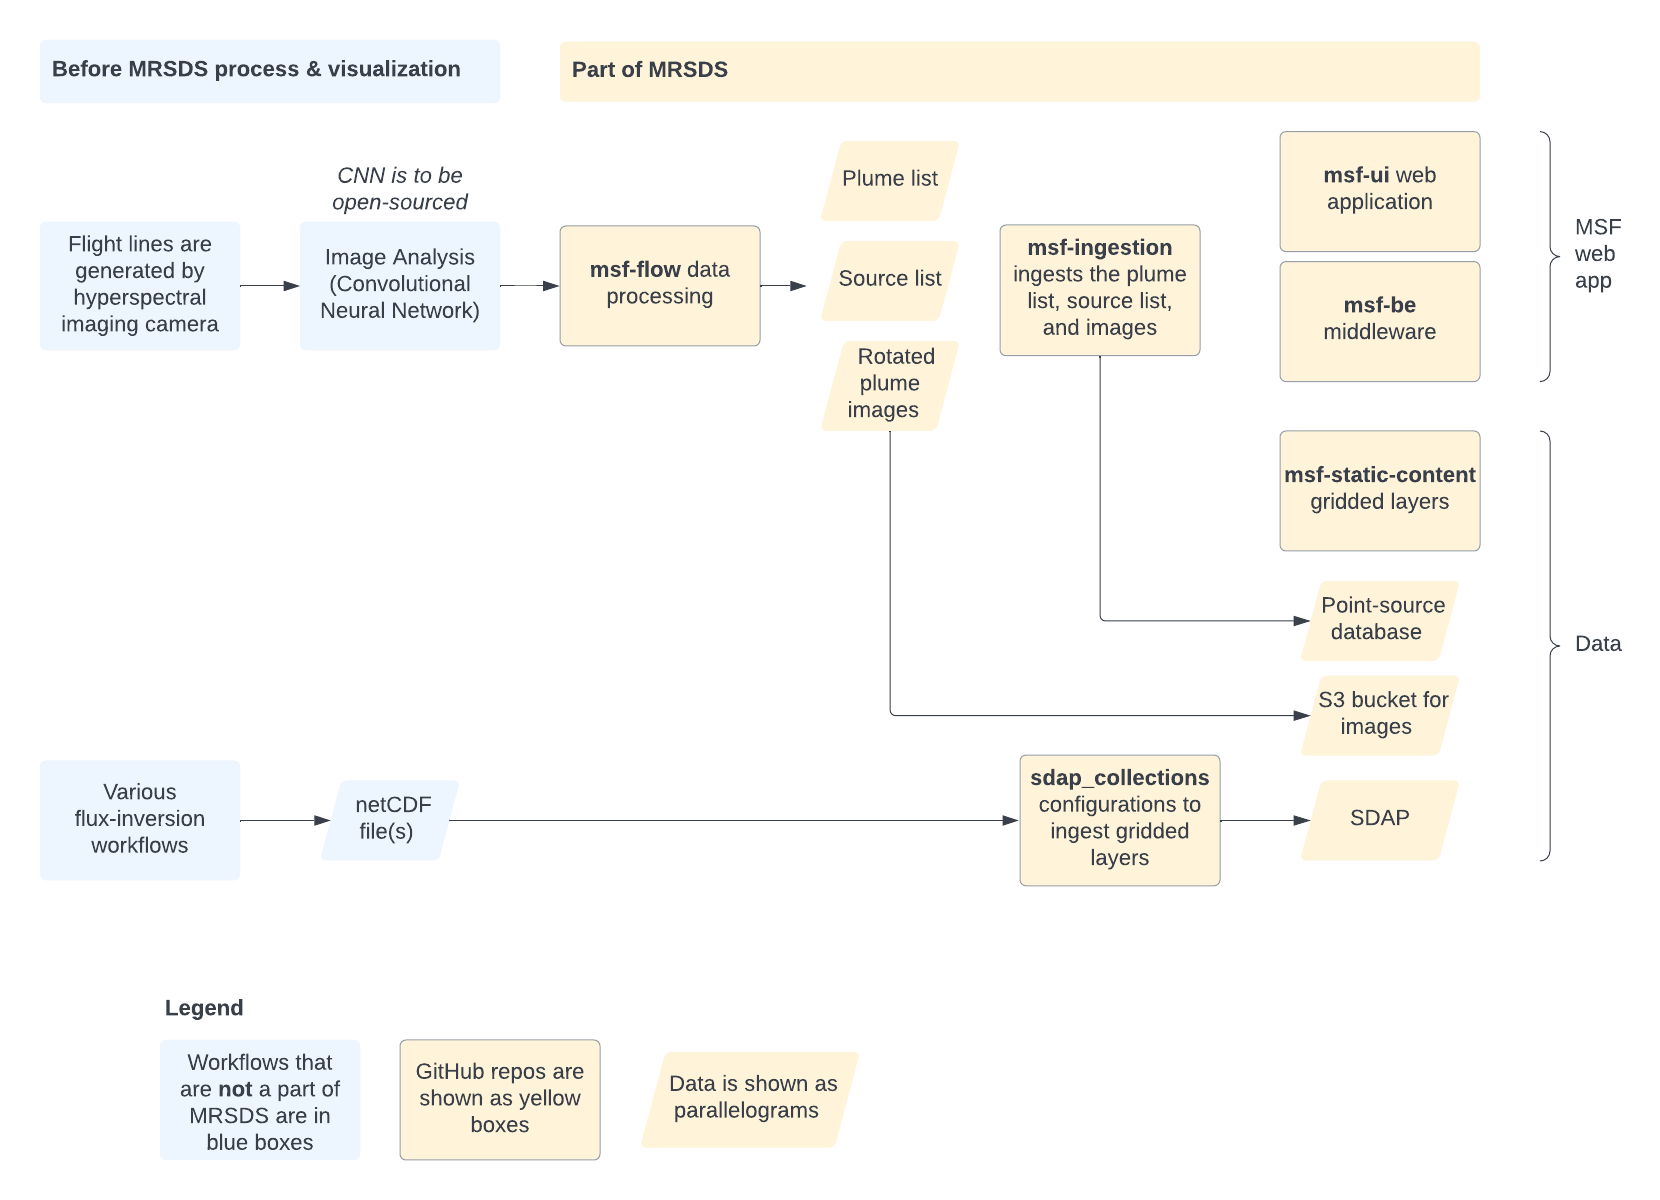
The following describes the function of each repository in the MRSDS
organization:
-
mrsds.github.io: This documentation.
-
msf-flow: Local plume processing pipeline, including data
harvester, workflow deployment on AWS, wind processor, and plume
post-processing and filtering.
-
msf-ui: This is the front-end map client code based on Common Mapping Client.
-
msf-ui-design: The Figma files with screen designs. Open them at http://figma.com
-
msf-portal-docker: Used to build Docker containers of the components needed to run the Methane Source Finder web application: msf-ui, msf-be and msf-static-layers.
-
msf-ingestion: Ingest point-source data and GeoTIFF plume-images into the methane portal database.
-
msf-static-layers: Gridded base layers of data; Dockerized.
-
msf-be: Back-end to methane portal. Includes setting up the point-source data base and providing all the server APIs used by msf-ui to get the data.
-
MethaneSourceFinder-BackEndDocker:
-
MethaneSourceFinder-FrontEndDocker:
-
MethaneSourceFinder-StaticContentDocker:
-
sdap_collections: Example SDAP dataset collection configuration.
-
sdap_notebooks: Example SDAP analytics in a Jupyter notebook.
In order to run the Methane Source Finder (MSF) web application you will need to use msf-ui (the web app), msf-be (the back-end that serves up APIs to provide data to the UI), and msf-static-layers (gridded data layers that are stored as flatfiles), plus a database with the point-source data and GeoTIFF plume-images (loaded by msf-ingestion).
In order to run the point-source data pipeline you will need msf-flow.
SDAP data ingestion and test Jupyter notebooks are in the sdap_collections and sdap_notebooks repos
Science Data Analytics Platform (SDAP)
We have demonstrated the use of the open-source
Science Data Analytics Platform (SDAP)
to perform basic analytics on our gridded methane data products,
like our regional and global inversions. SDAP uses Apache Spark
for parallel computations in the "map-reduce" style. In
map-reduce computations, one or more "map" functions operate
independently on different subsets of the data. Reduction
operators combine the distributed map results to produce the
final analytics product. The final product is expected to be
smaller than the collection of input data files that were used
to compute the result. In this way, SDAP performs the
computations remotely, close to the data, and eliminates the
need for large data file downloads.
SDAP Web Service API
Analytics requests to SDAP are done using a web service API that can
be done in a variety of programming languages or in any web browser.
Please refer to
Jupyter Notebooks
for examples of how to make calls to SDAP in Python.
SDAP Datastore
SDAP delivers rapid subsetting by using a tile-based datastore,
instread of operating on many files. The data array for each
variable of interest is partitioned into equal sized tiles, each
covering a particular time range and coordinate bounds. These
tiles are ingested into the SDAP datastore, which has two
components:
-
Solr: Hosts tile attributes, including a unique identifier
for each tile, spatial bounds, time range covered, and summary
statistics; Enables rapid geospatial search for tiles that intersect
a user-defined bounding box.
-
Cassandra: Hosts the actual data tiles, and enables each
tile to be directly retrieved using its unique identifier,
retrieved from Solr.
The SDAP algorithms rapidly access the necessary data subsets in a
two-step process. First, it performs a geospatial search in Solr to
extract the unique identifiers of the data tiles that intersect the
time range and spatial area of interest. It then uses those tile
identifiers as keys to directly access the tile data from
Cassandra's key-value store.
SDAP Analytics Algorithms
The SDAP analytics algorithms
that may highly relevant to multi-scale methane analysis are:
-
Area-averaged time series: Compute a spatial mean for each
timestamp.
-
Time averaged map: Compute a time average for each spatial
-
Correlation map: Compute the correlation coefficient for two
identically sampled/gridded datasets.
-
Daily difference average: Compute a spatial mean of the
difference between a dataset and its climatology (long term average)
for each timestamp.
All of the SDAP computations can be constrained to a spatiotemporal
bounding box.
SDAP Deployment
SDAP is deployed using Kubernetes and Helm. A functional SDAP consists
of the following components:
-
nexus-webapp-driver: 1 pod that listens for incoming web
service calls (SDAP job requests), and routes them to the appropriate
handler.
-
nexus-analysis-exec: 1 or more Apache Spark executor pods
that perform a share of the work needed to fulfill an SDAP job
request.
-
sdap-solr: 1 or more replicas of Solr, which is the component
of the SDAP datastore that enables geospatial search for data tiles
that intersect a spatio-temporal bounding box.
-
sdap-zookeeper: 1 or more replicas of Zookeeper, which is
a sidecar app that handles syncronization and configuration required
for Solr.
-
sdap-cassandra: 1 or more replicas of Cassandra, which is the
component of the SDAP datastore that enables key lookup and retrieval
of data tile values.
-
collection-manager: 1 pod that keeps track of the datasets
that have been ingested in to an SDAP deployment. It watches a
folder on AWS S3 or a directory on the local file system for new
files to ingest for each dataset. When it finds a new file, it
schedules an ingest job for that file on a queue in RabbitMQ that
is being watched by the Granule Ingesters (see below).
-
rabbitmq: Deployment of RabbitMQ with a queue set up for
ingest jobs consisting of a file to be ingested. This queue is
populated by the Collection Manager component, and jobs are popped
off the queue by the Granule Ingester(s).
-
granule-ingester: 1 or more ingest workers that pop ingest
jobs off of a queue in RabbitMQ, slice the file to be ingested in to
tiles, and ingest the tiles in to the Solr/Cassadra datastore.
SDAP Data Ingest
To run analytics on a
dataset with SDAP you need to first "ingest" the dataset. Please refer
to the
SDAP helm deployment instructions
to learn how to do deploy and ingest data in to SDAP. SDAP can support
ingest from NetCDF4 or HDF5 files that follow
CF Metadata Conventions.
As described in the SDAP documentation, you will need to compose a
dataset configuration in YAML format in order to configure a dataset
for ingest. Please refer to the examples we provided at
Example collections.yaml.
Additional Recommendations to use SDAP
The following are some additional recommendations that we have found
increase the likelihood that the SDAP ingesters will support the
data files:
-
In your NetCDF files, you will provide latitude and longitude
dimensions and also variables that provide values for those
dimensions. You should ensure that the dimension name matches the
corresponding variable name. For example, the header should have
something like:
dimensions:
    lat = 100 ;
variables:
    float lat(lat) ;
and do not do this:
dimensions:
    lat = 100 ;
variables:
    float latitude(lat) ;
-
In your NetCDF files you will provide a time dimension and variable.
You shoudl ensure your time variable has units of a form accepted
by the CF Conventions. For example, this is an appropriate time
unit:
time:units = "seconds since 1970-01-01T00:00:00Z"
-
The variable being ingested should be arranged so that the
dimensions are indexed in the following order:
- time
- latitude
- longitude
For example, the following should work fine with SDAP:
float fluxes(time, lat, lon) ;
-
The variable being ingested can have fill values for grid cells
without valid values. You should identify the fill value using the
standard variable attribute,
_FillValue
the end.